You have no items in your shopping cart.
Cart summary
Item 1 of 6
Item 1 of 6

| Catalog Number | orb345910 |
|---|---|
| Category | Antibodies |
| Description | RFP antibody |
| Species/Host | Gallus |
| Clonality | Polyclonal |
| Tested applications | ELISA, WB |
| Reactivity | Other |
| Isotype | IgY |
| Immunogen | The immunogen is a Red Fluorescent Protein (RFP) fusion protein corresponding to the full length amino acid sequence (234aa) derived from the mushroom polyp coral Discosoma. |
| Concentration | 1.0 mg/mL |
| Dilution range | ELISA: 1:10,000, WB: 1:1,000 - 1:3,000 |
| Form/Appearance | Liquid (sterile filtered) |
| Purity | RFP Antibody was prepared from egg yolks by a multi-step process which includes filtration, delipidation, salt fractionation and extensive dialysis against the buffer stated above. RFP Antibody was tested by western blot. |
| Conjugation | Unconjugated |
| UniProt ID | Q9U6Y8 |
| Storage | Store vial at -20° C prior to opening. Aliquot contents and freeze at -20° C or below for extended storage. Avoid cycles of freezing and thawing. Centrifuge product if not completely clear after standing at room temperature. This product is stable for several weeks at 4° C as an undiluted liquid. Dilute only prior to immediate use. |
| Buffer/Preservatives | 0.01% (w/v) Sodium Azide |
| Alternative names | chicken anti-RFP antibody, DsRed, rDsRed, Discosom Read more... |
| Note | For research use only |
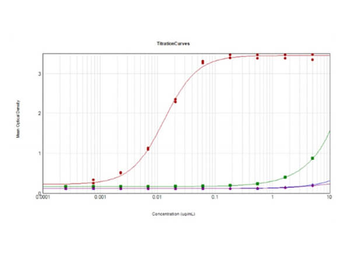
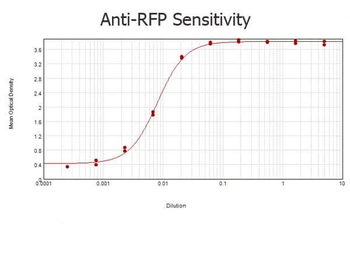
| Application notes | Anti-RFP is designed to detect recombinant RFP. Anti-RFP antibody has been tested by ELISA, SDS-PAGE, and western blot to detect RFP. Use either alkaline phosphatase or peroxidase conjugated polyclonal anti-RFP to detect RFP or RFP containing proteins on western blots. Optimal titers for applications should be determined by the researcher. This product shows optimal performance by western blot. |
| Expiration Date | 12 months from date of receipt. |
Kivelä, Riikka et al. The transcription factor Prox1 is essential for satellite cell differentiation and muscle fibre-type regulation Nat Commun, 7, 13124 (2016)
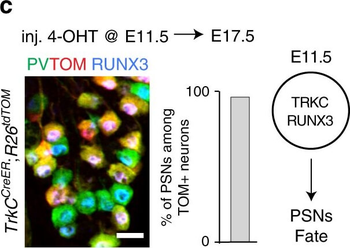
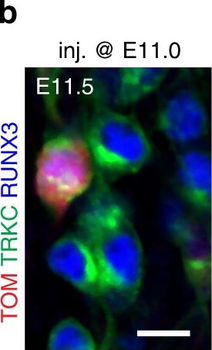
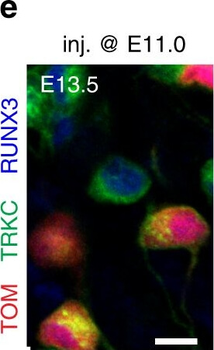
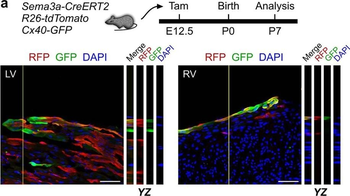
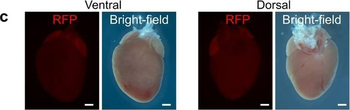
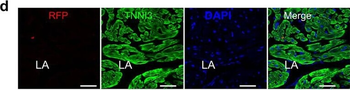
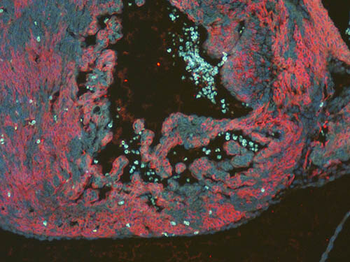
Differential expression of TRKC in PSNs prior to the cell death period. a Scheme of our working hypothesis. b, c Temporal fate mapping of TRKC PSNs by 4-OHT induction. TrkCCreER mice allow temporary activation of CreER in the TRKC+ cells 2 h after 4-OHT injection21, 22. Immunostaining for PV, RFP and RUNX3 on E17.5 DRG sections (c) and graph showing distribution of PV+ /RUNX3+ PSNs among the TOM+ cells (n=4). Scale bar: 20 μm. d Quantification of PSNs at C5 and C7. ***P < 0.001, one-way analysis of variance (ANOVA) with Sidak's multiple comparisons test (n=2–3). The window of PSNs cell death is shown. e TRKC expression in E11.5 ISL1+ (and RUNX3+, whose staining is not shown for more visibility) DRG neurons. Scale bar: 50 μm. f TRKC levels in PSNs of e illustrated by color coding; dark blue indicates the lower and red the higher TRKC levels. From here, all observations are done at brachial levels (C5–8). g Distribution of TRKC levels in PSNs from e. h Distribution of TRKC levels in PSNs in E11.5 DRG neurons (from g). The data exhibit a Poisson-like distribution (one representative animal), with the mean used to define the two different categories of TRKC intensity (TRKCHigh and TRKCLow). i Projection of seven images of RUNX3+ /TRKC+ PSNs from one brachial DRG; dots indicate TRKC-labeled neurons and color codes reveal TRKC intensity as shown in h. j Projection image of smFISH for pan Ntrk3 and Ntrk3 full length (FL) transcripts in E11.5 DRG, visualized at high magnification in (1) and (2) (images show full projection); right panel shows color coding of Ntrk3 FL levels in red; the brighter, the higher levels. k Distribution of the number of Ntrk3 FL molecules in E11.5 DRG neurons by smFISH, normalized to pan Ntrk3 (Ntrk3 FL represent 68% of all Ntrk3 transcripts). lTrkCCreER;R26tdTOM mice were injected at E9.75 with 4-OHT and analyzed at E11.5 (n=3). m, n Frequency distribution (m) and pie chart (n) of TOM+ /TRKC+ neurons from l according to their level of TRKC intensity.
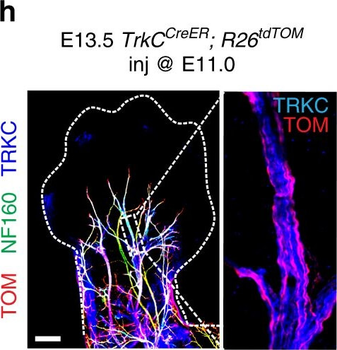
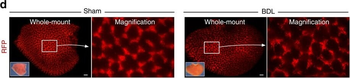
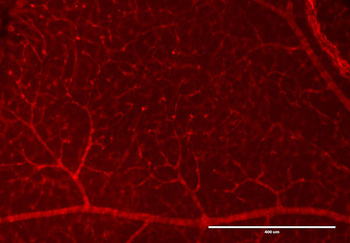
PSNs with high TRKC levels preferentially survive the cell death period. a Temporal fate mapping of TRKCHigh PSNs by 4-OHT (low dose, 0.02 g/kg). b–d Injection of TrkCCreER;R26tdTOM mice with low dose of 4-OHT at E11.0; DRG analyzed at E11.5 with recombination in few (b), preferentially high TRKC PSNs (c, d) (P < 0.001). Frequency distribution of TOM+ PSNs according to TRKC intensity (c) and pie charts (d) illustrating the large proportion of TOM+ cells among TRKCHigh PSNs. Scale bar: 50 μm. e, f Percentage of recombined PSNs at E11.5 and E13.5 in DRGs from TrkCCreER;R26tdTOM animals after 4-OHT injection at E11.0 (*P < 0.05, Student's t-test; n=2 litters with 6 embryos, E11.5; 2 litters with 5 embryos, E13.5). g The percentage of labeled PSNs does not change between E11.5 and E13.5 in R26CreERT2;R26tdTOM embryos injected at E11.0 with 0.032 g/kg 4-OHT (n=4). Similarly, the recombination rate in TOM+ PSNs does not change between E14.5 and E16.5 in TrkCCreER;R26tdTOM embryos after injection at E14.0 with 0.02 g/kg 4-OHT (n=2). Unpaired Student's t-test. h Whole-mount immunostaining for TRKC, NF160 and RFP of E13.5 forelimb from TrkCCreER;R26tdTOM embryos injected with low dose 4-OHT at E11.0. Insert shows restricted number of TOM+ fibers dispersed amongst TRKC+ axons. Scale bar: 200 μm. i Pattern and color-coded depth (in micrometers) of innervation of TRKC+, NF160+ and RFP+ nerve fibers (processed from h) of E13.5 forelimb from TrkCCreER;R26tdTOM embryos injected with a low dose of 4-OHT (0.02 g/kg) at E11. The pattern and depth color code reveal similar territories (in all dimensions, xyz) of innervation of the TOM+ PSNs compared to all axons (NF160). Scale bar: 200 μm. j Scheme illustrating the preferential selection of TRKCHigh PSNs during the cell death period.
PSNs with high TRKC levels preferentially survive the cell death period. a Temporal fate mapping of TRKCHigh PSNs by 4-OHT (low dose, 0.02 g/kg). b–d Injection of TrkCCreER;R26tdTOM mice with low dose of 4-OHT at E11.0; DRG analyzed at E11.5 with recombination in few (b), preferentially high TRKC PSNs (c, d) (P < 0.001). Frequency distribution of TOM+ PSNs according to TRKC intensity (c) and pie charts (d) illustrating the large proportion of TOM+ cells among TRKCHigh PSNs. Scale bar: 50 μm. e, f Percentage of recombined PSNs at E11.5 and E13.5 in DRGs from TrkCCreER;R26tdTOM animals after 4-OHT injection at E11.0 (*P < 0.05, Student's t-test; n=2 litters with 6 embryos, E11.5; 2 litters with 5 embryos, E13.5). g The percentage of labeled PSNs does not change between E11.5 and E13.5 in R26CreERT2;R26tdTOM embryos injected at E11.0 with 0.032 g/kg 4-OHT (n=4). Similarly, the recombination rate in TOM+ PSNs does not change between E14.5 and E16.5 in TrkCCreER;R26tdTOM embryos after injection at E14.0 with 0.02 g/kg 4-OHT (n=2). Unpaired Student's t-test. h Whole-mount immunostaining for TRKC, NF160 and RFP of E13.5 forelimb from TrkCCreER;R26tdTOM embryos injected with low dose 4-OHT at E11.0. Insert shows restricted number of TOM+ fibers dispersed amongst TRKC+ axons. Scale bar: 200 μm. i Pattern and color-coded depth (in micrometers) of innervation of TRKC+, NF160+ and RFP+ nerve fibers (processed from h) of E13.5 forelimb from TrkCCreER;R26tdTOM embryos injected with a low dose of 4-OHT (0.02 g/kg) at E11. The pattern and depth color code reveal similar territories (in all dimensions, xyz) of innervation of the TOM+ PSNs compared to all axons (NF160). Scale bar: 200 μm. j Scheme illustrating the preferential selection of TRKCHigh PSNs during the cell death period.
PSNs with high TRKC levels preferentially survive the cell death period. a Temporal fate mapping of TRKCHigh PSNs by 4-OHT (low dose, 0.02 g/kg). b–d Injection of TrkCCreER;R26tdTOM mice with low dose of 4-OHT at E11.0; DRG analyzed at E11.5 with recombination in few (b), preferentially high TRKC PSNs (c, d) (P < 0.001). Frequency distribution of TOM+ PSNs according to TRKC intensity (c) and pie charts (d) illustrating the large proportion of TOM+ cells among TRKCHigh PSNs. Scale bar: 50 μm. e, f Percentage of recombined PSNs at E11.5 and E13.5 in DRGs from TrkCCreER;R26tdTOM animals after 4-OHT injection at E11.0 (*P < 0.05, Student's t-test; n=2 litters with 6 embryos, E11.5; 2 litters with 5 embryos, E13.5). g The percentage of labeled PSNs does not change between E11.5 and E13.5 in R26CreERT2;R26tdTOM embryos injected at E11.0 with 0.032 g/kg 4-OHT (n=4). Similarly, the recombination rate in TOM+ PSNs does not change between E14.5 and E16.5 in TrkCCreER;R26tdTOM embryos after injection at E14.0 with 0.02 g/kg 4-OHT (n=2). Unpaired Student's t-test. h Whole-mount immunostaining for TRKC, NF160 and RFP of E13.5 forelimb from TrkCCreER;R26tdTOM embryos injected with low dose 4-OHT at E11.0. Insert shows restricted number of TOM+ fibers dispersed amongst TRKC+ axons. Scale bar: 200 μm. i Pattern and color-coded depth (in micrometers) of innervation of TRKC+, NF160+ and RFP+ nerve fibers (processed from h) of E13.5 forelimb from TrkCCreER;R26tdTOM embryos injected with a low dose of 4-OHT (0.02 g/kg) at E11. The pattern and depth color code reveal similar territories (in all dimensions, xyz) of innervation of the TOM+ PSNs compared to all axons (NF160). Scale bar: 200 μm. j Scheme illustrating the preferential selection of TRKCHigh PSNs during the cell death period.
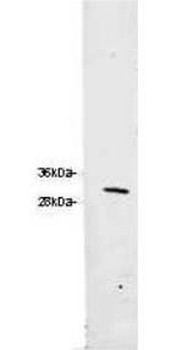
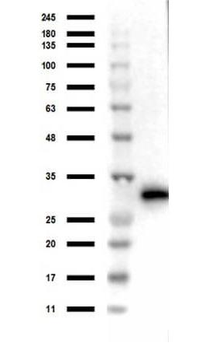
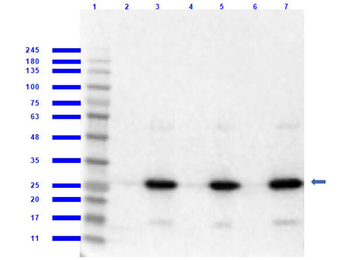
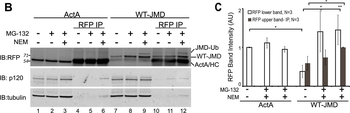
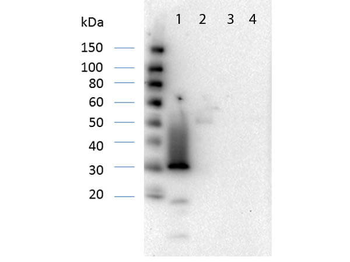
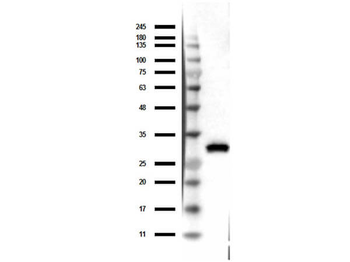
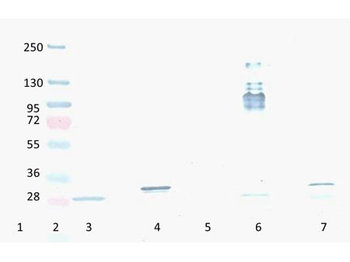
Western blot of Biorbyt's Chicken Anti-RFP Antibody. Loaded 0.1 µg of RFP protein (p/n orb345960) on a 4-20% gel and transferred to nitrocellulose membrane. Chicken anti-RFP Antibody was added at 1.0 µg/mL at RT for 2 hours. IRDye800® goat anti-Chicken was added at 1:20000 at RT for 45 minutes.
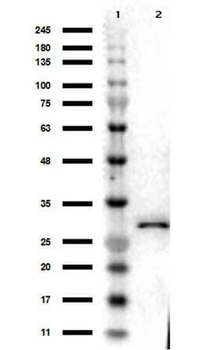
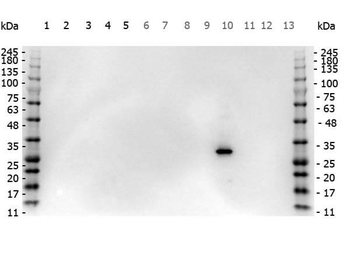
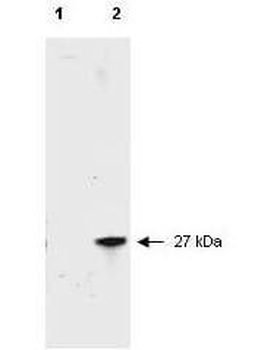
Western Blot Results of Chicken Anti-RFP Antibody. Lane 1: Opal PreStained Molecular Weight Marker. Lane 2: RFP (p/n orb345960), load 50 ng. Primary Antibody: Anti-RFP 1 µg/mL overnight at 4°C. Secondary Antibody: Goat Anti-Chicken HRP (p/n orb346892) at 1:40000 for 30 min at RT. Blocking: BlockOut (p/n orb348644) for 30 min at RT. Expect: 27 kDa.
- Item 1 of 45
- Item 1 of 45
- Item 1 of 2
- Item 1 of 12
- Item 1 of 12


Submit a review
Filter by Rating

- 5 stars

- 4 stars
- 3 stars
- 2 stars
- 1 stars
