You have no items in your shopping cart.
Cart summary
Item 1 of 6
Item 1 of 6
Rabbit IgG (H&L) Antibody Rhodamine Conjugated Pre-Adsorbed
Catalog Number: orb347751

| Catalog Number | orb347751 |
|---|---|
| Category | Antibodies |
| Description | Rabbit IgG (H&L) antibody (TRITC) |
| Species/Host | Donkey |
| Clonality | Polyclonal |
| Tested applications | FC, FLISA, IF |
| Reactivity | Rabbit |
| Isotype | IgG |
| Immunogen | Rabbit IgG whole molecule |
| Concentration | 1.0 mg/mL |
| Dilution range | FLISA: 1:10,000 - 1:50,000, FC: 1:500 - 1:2,500, IF: 1:1,000 - 1:5,000 |
| Form/Appearance | Lyophilized |
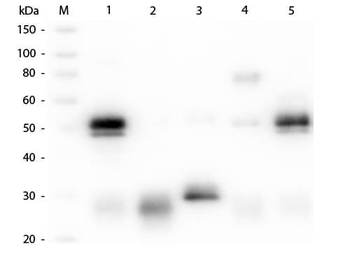
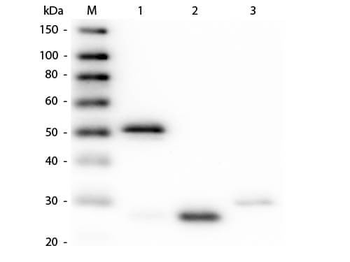
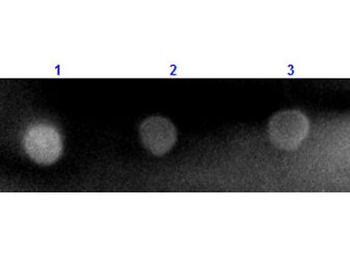
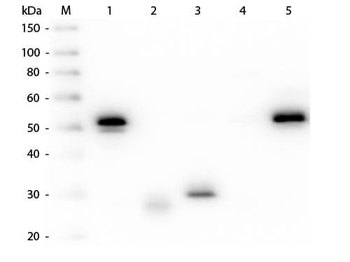
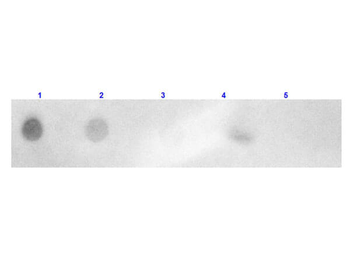
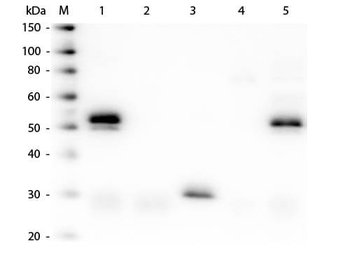
| Purity | This product was prepared from monospecific antiserum by immunoaffinity chromatography using Rabbit IgG coupled to agarose beads followed by solid phase adsorption(s) to remove any unwanted reactivities. Assay by immunoelectrophoresis resulted in a single precipitin arc against anti-Donkey Serum, Rabbit IgG and Rabbit Serum. No reaction was observed against Bovine, Chicken, Goat, Guinea Pig, Hamster, Horse, Human, Mouse, Rat and Sheep Serum Proteins. |
| Conjugation | TRITC |
| Storage | Store vial at 4° C prior to restoration. For extended storage aliquot contents and freeze at -20° C or below. Avoid cycles of freezing and thawing. Centrifuge product if not completely clear after standing at room temperature. This product is stable for several weeks at 4° C as an undiluted liquid. Dilute only prior to immediate use. |
| Buffer/Preservatives | 0.01% (w/v) Sodium Azide |
| Alternative names | Donkey anti-Rabbit IgG Antibody Rhodamine Conjugat Read more... |
| Note | For research use only |
| Application notes | Anti-Rabbit IgG (H&L) Rhodamine Antibody is designed for immunofluorescence microscopy, fluorescence based plate assays (FLISA) and fluorescent western blotting. This product is also suitable for multiplex analysis, including multicolor imaging, utilizing various commercial platforms. |
| Expiration Date | 12 months from date of receipt. |
Nishimura, Kei et al. Glucagon-like peptide-1 is co-localized with neurotensin in the chicken ileum Cell Tissue Res, 368, 277-286 (2017)
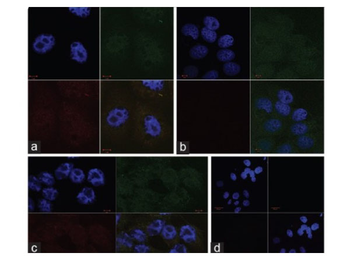
Confocal microscopy imaging of particles coated by BODIPY-labeled (green fluorescence) and CD14 stained NR8383 cells (red fluorescence): (A) Cells exposed to 10 µg/cm2 DQ12 after 30 min of incubation (Left: fluorescence image; right: transmitted light image of not stained cells) (B) Unexposed cells (C) Cells exposed to 10 µg/cm2 of DQ12 after 60 min of incubation (D) Cells exposed to 10 µg/cm2 of CS after 60 min of incubation. For B, C, and D: Upper left: transmitted green fluorescence; Upper right: transmitted red fluorescence; Lower left: transmitted fused green and red fluorescence; Lower right: sham.
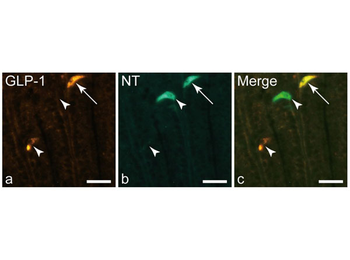
Distribution in the chicken distal ileum of three types of enteroendocrine cells. Enteroendocrine cell types were identified by a double immunofluorescence technique for glucagon-like peptide-1 (GLP-1) and neurotensin (NT). Arrows indicate cells showing immunoreactivity for both GLP-1 and NT (GLP-1+ /NT+). Arrowheads indicate cells containing either GLP-1 (GLP-1+ /NT−) or NT (GLP-1− / NT+). Bars 20 µm.
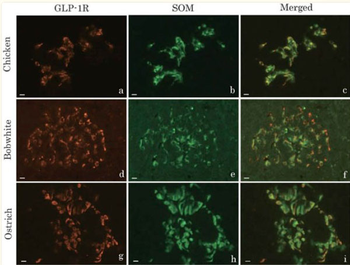
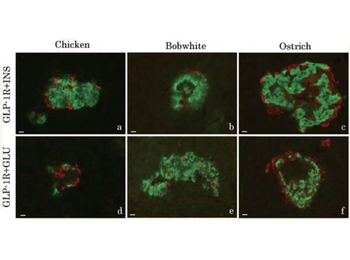
Double immunofluorescence images of glucagon-like peptide-1 receptor (GLP-1R, a, d, g) and somatostatin (SOM, b, e, h) in the pancreatic islets of chickens (a–c), northern bobwhites (d–f), and ostriches (g–i). Figures c, f, and i show merged images of a and b, d and e, and g and h, respectively. Almost every SOM-immunoreactive cell in the pancreatic islets of three avian species also demonstrated GLP-1R immunoreactivity. Bars indicate 10 µm.
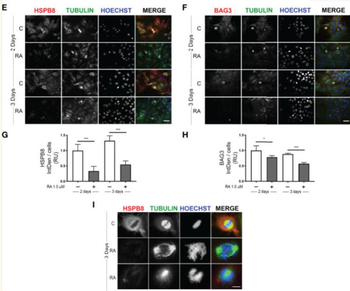
Effect of RA treatment in MCF-7 cells. (E) Immunofluorescence analysis of HSPB8 (red) and tubulin (green) in MCF-7 cells treated for 2 and 3 days with 1 µm RA, nuclei were stained with Hoechst (scale bar = 20 µm). (F) Immunofluorescence analysis of BAG3 (red) and tubulin (green) in MCF-7 cells treated for 2 and 3 days with 1 µm RA (scale bar = 20 µm). (G, H) Fluorescent intensity quantification of HSPB8 and BAG3, nuclei were stained with Hoechst. (I) Higher magnification of the mitotic spindle (scale bar = 5 µm). *p < 0.05, **p < 0.01 and ***p < 0.005 in all charts. Graph bars represent the mean of three independent experiments.
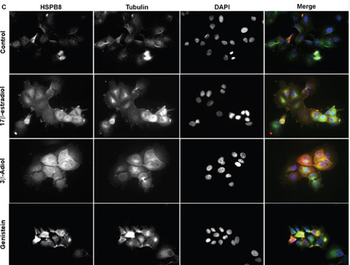
Expression of HSPB8 in MCF-7 cell lineHSPB8 mRNA and protein levels were quantified by real-time RT-PCR analysis. (C) Representative pictures of immunofluorescence staining of HSPB8 (red, anti-rabbit) and α-tubulin (green, anti-mouse) in MCF-7 cells, treated as above for 2 days. DAPI (blue) was used to stain DNA. *P < 0.05 vs Control. Values represent the mean from three independent experiments. C. Control cells; E: 17β-estradiol; EV: estradiol valerate; 3β: 3β-Adiol; Gen: genistein; Ral: raloxifen; Tam: tamoxifen.

Immunofluorescent staining for GLP-1 (a, c) and GLP-2 (b, c') in the chicken distal ileum. a, b: Single immunofluorescent staining for GLP-1 (a) and GLP-2 (b). Both immunoreactive cells are scattered in villous epithelium and crypt of the distal ileum and show the similar localization to that indicated by double immunofluorescent staining. c, c': Double immunofluorescent staining for GLP-1 (c) and GLP-2 (c'). Most GLP-1-immunoreactive cells also show immunoreactivity for GLP-2. Bar = 20 µm.
- Item 1 of 3
Rabbit IgG (H&L) Antibody Rhodamine Conjugated Pre-Adsorbed [orb347644]
FC, FLISA, IF
Rabbit
Goat
Polyclonal
TRITC
1 mg - Item 1 of 2
Rabbit IgG (H&L) Antibody Pre-Adsorbed [orb347715]
DOT, FC, FLISA, IF
Rabbit
Guinea pig
Polyclonal
TRITC
1 mg - Item 1 of 2
Rabbit IgG (H&L) Antibody Pre-Adsorbed [orb347722]
DOT, FC, FLISA, IF
Rabbit
Mouse
Polyclonal
TRITC
1 mg - Item 1 of 2
Rabbit IgG (H&L) Antibody Rhodamine Conjugated Pre-Adsorbed [orb347651]
DOT, FC, FLISA, IF
Rabbit
Goat
Polyclonal
TRITC
2 mg - Item 1 of 1
Rabbit IgG (H&L) Antibody Rhodamine Conjugated Pre-Adsorbed [orb347729]
FC, FLISA, IF
Rabbit
Rat
Polyclonal
TRITC
1 mg