You have no items in your shopping cart.
Cart summary
Item 1 of 8
Item 1 of 8
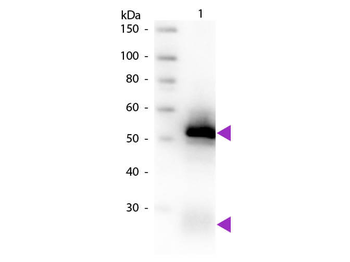
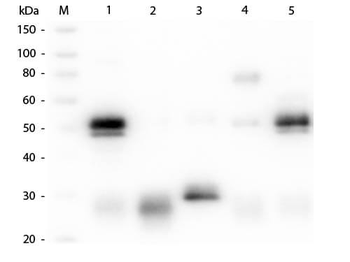
Rabbit IgG (H&L) Antibody Biotin Conjugated
Catalog Number: orb347769

| Catalog Number | orb347769 |
|---|---|
| Category | Antibodies |
| Description | RABBIT IgG (H&L) antibody (Biotin) |
| Species/Host | Donkey |
| Clonality | Polyclonal |
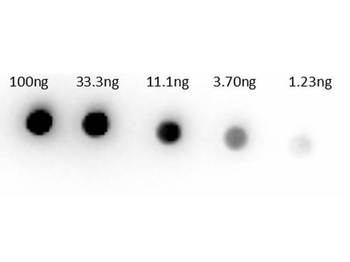
| Tested applications | ELISA, IHC, WB |
| Reactivity | Rabbit |
| Isotype | IgG |
| Immunogen | Rabbit IgG whole molecule |
| Concentration | 2.0 mg/mL |
| Dilution range | ELISA: 1:300,000, IHC: 1:500 - 1:3000, WB: 1:3,000 - 1:15,000 |
| Form/Appearance | Lyophilized |
| Purity | This product was prepared from monospecific antiserum by immunoaffinity chromatography using Rabbit IgG coupled to agarose beads followed by solid phase adsorption(s) to remove any unwanted reactivities. Assay by immunoelectrophoresis resulted in a single precipitin arc against anti-biotin, anti-Donkey Serum, Rabbit IgG and Rabbit Serum. |
| Conjugation | Biotin |
| Storage | Store vial at 4° C prior to restoration. For extended storage aliquot contents and freeze at -20° C or below. Avoid cycles of freezing and thawing. Centrifuge product if not completely clear after standing at room temperature. This product is stable for several weeks at 4° C as an undiluted liquid. Dilute only prior to immediate use. |
| Buffer/Preservatives | 0.01% (w/v) Sodium Azide |
| Alternative names | Donkey anti-Rabbit IgG Biotin Conjugated Antibody, Read more... |
| Note | For research use only |
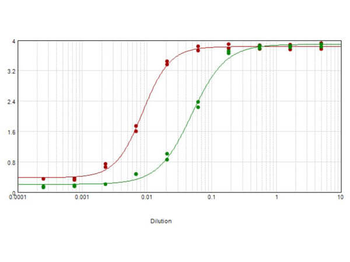
| Application notes | Anti-Rabbit IgG (H&L) Biotin Antibody has been tested by ELISA and is ideal for ELISA, western blotting, Immunohistochemistry, Fluorescence Microscopy, Flow Cytometry as well as other antibody detection methods. |
| Expiration Date | 12 months from date of receipt. |

ELISA standard curves obtained from microtiter plates coated with SARS‐CoV‐2 S1 protein and stored under different conditions for A) 8 days, B) 24 days, and C) 32 days. D) Preservation efficacy as calculated from the OD values in the linear range of ELISA standard curves of SARS‐CoV‐2 S1 protein‐coated microtiter plates. E) Comparison of LODs of SARS‐CoV‐2 S1 protein coated plates stored under different conditions. F) OD values obtained from SARS‐CoV‐2 S1 protein‐coated plates after treatment with different concentrations of proteases. G) Preservation efficacy of ZIF‐90 protected plates after thermal treatment and then exposing to protease. H) Comparison of LODs of SARS‐CoV‐2 N protein coated microtiter plates stored under different conditions. I) Preservation efficacy as calculated from the OD values in the linear range of ELISA standard curves of SARS‐CoV‐2 N protein precoated plates. E‐G, I) n = 2, *P < 0.05, **P < 0.01, ***P < 0.005, ****P < 0.0001, analyzed by unpaired t‐test. Data represent mean ± s.d.
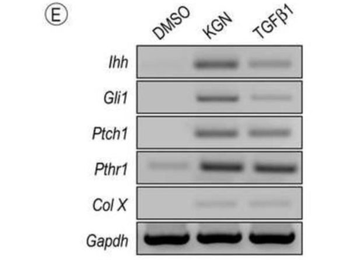
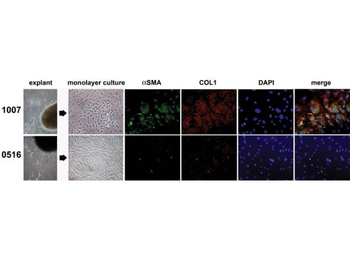
Hedgehog signaling is stimulated by KGN. (E) RT-PCR analysis of hedgehog signaling and maturation related molecules in E12.5 limb bud mesenchymal cells maintained in micromass culture and treated with 100 nM KGN or 2.5 ng/mL TGFβ1 for 24h. Note that similar responses were achieved by treatment with either KGN or TGFβ1.
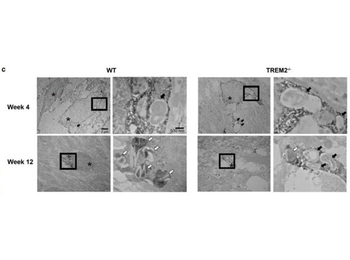
Immuno-electron microscopy using biotinylated anti-rabbit and streptavidin-HRP. Defect in myelin degradation in TREM2−/− microglia. (c) Immuno-EM images of TREM2−/− and WT microglia stained with Iba1 in the CC at 4 and 12 weeks on CPZ treatment. Images on the left in WT and TREM2−/−panels at week 4 and 12 (3000× magnification) depict Iba + microglial cells (asterisks). A higher magnification (15000×) for the boxed area is shown on the right of each image. Black arrows indicate phagosomes containing myelin debris. White arrows indicate pi granules.
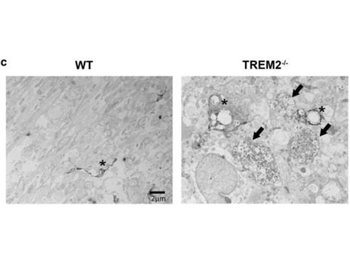
Immuno-electron microscopy using biotinylated anti-rabbit and streptavidin-HRP. TREM2−/− mice show more severe axonal pathology after CPZ. (c) EM images of WT and TREM2−/− at 12 weeks of CPZ treatment. Black arrows indicate dystrophic autophagocytic axons and asterisks indicate Iba1 + immunolabeled microglia.

Immunohistochemistry using Donkey anti-rabbit IgG biotin conjugated. (B) Similar results were observed by using double immunohistochemical staining with MCH (in black) and nesf-1 (in brown). Scale bars 50 m (D); 25 m (B).
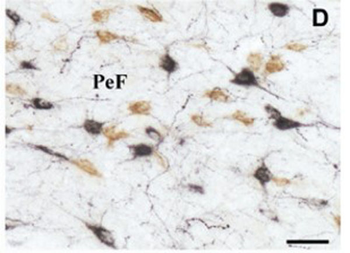
Immunohistochemistry using Donkey anti-rabbit IgG biotin conjugated. (D) Similar results were observed by using double immunohistochemical staining with Hcrt (in black) and nesf-1 (in brown). Scale bars 50 m (D); 25 m (B).
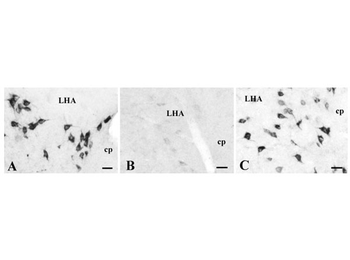
Immunohistochemistry using Donkey anti-rabbit IgG biotin conjugated. Specificity of the Ab24 antiserum. Photomicrographs of hypothalamic sections from the same rat processed simultaneously for nesf-1 immunodetection (with DAB-ni procedure) with normal Ab24 antiserum (control, A), pre-adsorbed antiserum with nesf-1 antigen (B) or pre-reacted primary antiserum with an excess of MCH (C). Notice the labeling extinction when using the pre-adsorbed Ab24 (B) vs. control (A), supporting its high specificity for nesf-1. Further, the primary antiserum pre-reacted with MCH did not induce qualitative or quantitative staining differences (C) vs. control (A), eliminating the possibility of Ab24 cross-reaction with MCH, co-expressed in nesf-1-immunoreactive neurons. Scale bars50 m.
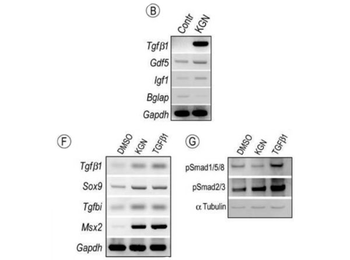
Modulation of signaling protein activities and growth factor expression by KGN. (A-B) E12.5 limbs were maintained ex vivo in control conditions or medium containing 1 µm KGN or 10 uL/mL DMSO as control. (A) Graphic representation of genes regulated more than two fold by KGN treatment in putative joint sites after 96h. Note the multi-fold induction of TGFβ1, Gdf5 and IGF1 expression with Gapdh set at 1; also included are two genes (Amhr2 and Bglap) that were down-regulated. (B) Image of RT-PCR analysis verifying the changes in expression of indicated genes by KGN. (C-G) E11.5 limbs bud mesenchymal cells were maintained in micromass cultures in control conditions or medium containing 100 nM KGN or 2.5 ng/mL TGFβ1 for 24h. Bright field images of micromass cultures stained with alcian blue. Note that both KGN and TGFβ1 stimulated cartilage nodule formation. (F) RT-PCR analysis of changes in gene expression of TGFβ target genes in micromass cultures treated with KGN or TGFβ1 compared to control cultures (DMSO). (G) Immunoblot analysis of levels of phosphorylated Smads in control, KGN-treated and TGFβ1-treated micromass cultures. Both KGN and TGFβ1 strongly up-regulated pSmad2/3 levels, but only TGFβ1 increased pSmad1/5/8 levels. Protein content per lane was verified by immunoblot with α-Tubulin antibodies.
- Item 1 of 8
Goat Anti-Rabbit IgG (H+L) Secondary Antibody, Biotin Conjugated [orb1474935]
ELISA, IHC
Rabbit
Goat
Polyclonal
Biotin
0.5 ml, 1 ml - Item 1 of 2
Rabbit IgG (H&L) Antibody Biotin Conjugated Pre-Adsorbed [orb347727]
ELISA, IHC, WB
Rabbit
Mouse
Polyclonal
Biotin
1 mg - Item 1 of 2
Rabbit IgG (H&L) Antibody Biotin Conjugated [orb347776]
ELISA, IHC, WB
Rabbit
Gallus
Polyclonal
Biotin
1 mg - Item 1 of 2
Rabbit IgG (H&L) Secondary Antibody Biotin Conjugated Pre-Adsorbed [orb347656]
ELISA, IHC, WB
Rabbit
Goat
Polyclonal
Biotin
1 mg - Item 1 of 2
Sheep IgG (H&L) Secondary Antibody Biotin Conjugated Pre-Adsorbed [orb347939]
DOT, ELISA, IHC, WB
Sheep
Rabbit
Polyclonal
Biotin
1 mg