You have no items in your shopping cart.
Cart summary
Item 1 of 6
Item 1 of 6
ATG13 (phospho-S318) antibody
Catalog Number: orb345689

| Catalog Number | orb345689 |
|---|---|
| Category | Antibodies |
| Description | ATG13 (phospho-S318) antibody |
| Species/Host | Rabbit |
| Clonality | Polyclonal |
| Tested applications | DOT, ELISA, FC, WB |
| Reactivity | Human |
| Isotype | IgG |
| Immunogen | This affinity purified antibody was prepared by repeated immunizations with a synthetic peptide corresponding to the region near S318 of ATG13. |
| Concentration | 1.1 mg/mL |
| Dilution range | ELISA: 1:25,000-1:175,000, FC: User Optimized, WB: 1:1000 |
| Form/Appearance | Liquid (sterile filtered) |
| Purity | This affinity-purified antibody is directed against the phosphorylated form of human ATG13 protein at the pS318 residue. The product was affinity purified from monospecific antiserum by immunoaffinity purification. Antiserum was first purified against the phosphorylated form of the immunizing peptide. The resultant affinity purified antibody was then cross adsorbed against the non-phosphorylated form of the immunizing peptide. Reactivity occurs against human ATG13 pS318 protein and the antibody is specific for the phosphorylated form of the protein. Reactivity with non-phosphorylated human ATG13 is minimal by ELISA and western blot. A BLAST analysis was used to suggest cross reactivity with ATG13 from human based on 100% sequence homology with the immunogen. Reactivity against homologues from other sources is not known. |
| Conjugation | Unconjugated |
| UniProt ID | O75143 |
| NCBI | NP_001136145.1 |
| Storage | Store vial at -20° C or below prior to opening. This vial contains a relatively low volume of reagent (25 µL). To minimize loss of volume dilute 1:10 by adding 225 µL of the buffer stated above directly to the vial. Recap, mix thoroughly and briefly centrifuge to collect the volume at the bottom of the vial. Use this intermediate dilution when calculating final dilutions as recommended below. Store the vial at -20°C or below after dilution. Avoid cycles of freezing and thawing. |
| Buffer/Preservatives | 0.01% (w/v) Sodium Azide |
| Alternative names | rabbit anti-ATG13 pS318 Antibody, ATG-13, ATG 13, Read more... |
| Note | For research use only |
| Application notes | This affinity purified antibody has been tested for use in ELISA and by western blot. Specific conditions for reactivity should be optimized by the end user. Expect a band approximately 56.6 kDa in size corresponding to human phosphorylated ATG13 protein by western blotting in the appropriate stimulated tissue or cell lysate or extract. |
| Expiration Date | 12 months from date of receipt. |

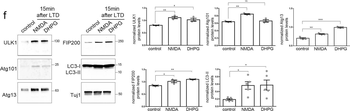
Autophagic vesicles are locally formed in dendrites of cultured neurons following LTD. A) Top, representative super-resolution microscopy dSTORM image of a secondary dendrite labeled with an antibody against LC3, 15 min after cLTD. Bottom, magnification of representative U-shaped LC3-positive structures in dendrites, 15 min after NMDA or DHPG pulses. Scale bars: 2 μm and 250 nm, as indicated. (n=3 independent experiments). B) Graph showing the number of LC3-positive U-shaped structures in secondary dendrites visualized in (a), before (control) and 15 min or 60 min after NMDAR- and mGluR-LTD. Bars represent mean values ± SEM. n=3 independent experiments per condition (n > 9 dendrites per condition). Statistical analysis was performed by one-way ANOVA. For the time point of 15 min F(2, 33) = 17.93, p 40 dendrites per condition). D) Confocal images of dendrites immunolabeled with antibodies against WIPI2, LC3, and MAP2 before (control) or after 15 min of NMDAR- and mGluR-LTD. Scale bar: 10 μm. (n=6 independent experiments). E) Representative confocal images of neurons immunolabeled with antibodies against ULK1, Atg101, Atg13, FIP200 and, along with MAP2 to label dendrites before (control) or 15 min after LTD-inducing pulses. Scale bar: 20 μm. Graphs showing the number of puncta positive for each ULK1-complex component in secondary dendrites, normalized for dendrite length, in every condition, as indicated. Graph bars represent mean values ± SEM. n=6 independent experiments per condition. Statistical analyses were performed using one-way ANOVA. ULK1: F(2, 15) = 24.48, P < 0.0001 (Tukey's multiple comparison test, Pcontrol_NMDAR < 0.0001, Pcontrol_mGluR < 0.0001, PNMDAR_mGluR = 0.8825). Atg101: F(2, 15) = 24.31, P < 0.0001 (Tukey's multiple comparison test, Pcontrol_NMDAR < 0.0001, Pcontrol_mGluR < 0.0001, PNMDAR_mGluR = 0.9329). Atg13: F(2, 15) = 8.386, P = 0.0036 (Tukey's multiple comparison test, Pcontrol_NMDAR = 0.007, Pcontrol_mGluR = 0.0086, PNMDAR_mGluR = 0.9940). FIP200: F(2, 15) = 17.66, P = 0.0001 (Tukey's multiple comparison test, Pcontrol_NMDAR = 0.0002, Pcontrol_mGluR = 0.0009, PNMDAR_mGluR = 0.6440). F) Western blot analyses for Atg13, FIP200, ULK1, Atg101, LC3, and β-III tubulin (Tuj1) in neuronal lysates, under control conditions and 15 min after NMDAR- and mGluR-LTD. Graphs showing the normalized protein levels of Atg13, FIP200, ULK1, Atg101 under the aforementioned conditions. Bars represent mean values ± SEM. n=3 independent experiments for ULK1 complex proteins, n=5 independent experiments for LC3-II. Statistical analyses were performed using one-way ANOVA. ULK1: F(2, 6) = 13.57, P = 0.0059 (Tukey's multiple comparison test Pcontrol_NMDA = 0.0056, Pcontrol_DHPG = 0.0253). Atg101: F(2, 6) = 27.57, P = 0.0009 (Tukey's multiple comparison test Pcontrol_NMDA = 0.0013, Pcontrol_DHPG = 0.79). Atg13: F(2, 6) = 113.1, P < 0.0001 (Tukey's multiple comparison test Pcontrol_NMDA = 0.0027, Pcontrol_DHPG < 0.0001). FIP200: F(2, 6) = 15.14, P = 0.0045 (Tukey's multiple comparison test Pcontrol_NMDA = 0.0240, Pcontrol_DHPG = 0.041). LC3-II: F (2, 12) = 4, 969, P = 0.0268 (Tukey's multiple comparison test Pcontrol_NMDA = 0.0478, Pcontrol_DHPG = 0.0421).

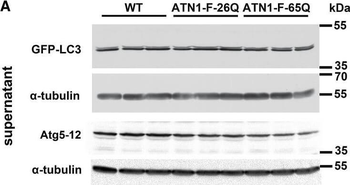
Inhibition of Autophagy Flux at Lysosomal Level and Decrease in Autophagy Initiation Signaling in DRPLA(A–C) The ratio of LC3II to LC3I was used to quantify autophagic flux in western blot analysis of full-length GFP-LC3 in the supernatant fraction of cerebellar lysates at 14 weeks of age (A). The anti-LC3 antibody recognizes a doublet between 35 and 55 kDa (Figure S4B), consistent with GFP-LC3-I (upper) and cleaved GFP-LC3-II (lower). The level of Atg5-12 conjugate was used to quantify the events of autophagy initiation. Densitometric analysis shows a decreased relative abundance of cleaved GFP-LC3-II to full-length GFP-LC3-I (B) in ATN1-FL-65Q;GFP-LC3 (65Q) mice compared to ATN1-FL-26Q;GFP-LC3 (26Q) and WT;GFP-LC3 (wt) mice. Atg5-12 conjugate (C) is also decreased in ATN1-FL-65Q;GFP-LC3 (65Q) compared to WT;GFP-LC3 (wt). Student's t test, mean ± SEM, ∗∗p < 0.01, ∗p < 0.05. (D–F) The accumulation of GFP cleavage product and autophagy receptor p62 was analyzed as a measure of autophagy flux blockage in western blot assay of the cerebellar lysates at 14 weeks of age (D). Mouse anti-GFP antibody recognizes only GFP-LC3-II (Figure S4B) and cleaved GFP after longer exposure. ∗Shorter exposure of anti-GFP signal. Densitometric analysis of the relative abundance of cleaved GFP to GFP-LC3-II (E) as well as the abundance of p62 relative to α-tubulin (F) in WT;GFP-LC3 mice (wt), ATN1-FL-26Q;GFP-LC3 (26Q) and ATN1-FL-65Q;GFP-LC3 (65Q) mice. Student's t test, mean ± SEM, ∗p < 0.05. (G) Accordingly, western blot analysis of autophagy shows a stall in autophagy flux in end-stage ATN1-FL-65Q mice compared to wild-type (WT) as evidenced by relative decrease of GFP-LC3-II as well as increase of p62 in the pellet fraction. ∗Anti-p62 antibody revealed an additional band 20 kDa above the expected band at around ∼60 kDa in the supernatant fractions of the cerebellum in end-stage mice. (H) qPCR analysis of Tfeb mRNA levels in the cerebellum of wild-type (wt, white), ATN1-FL-26Q (26Q, blue) and ATN1-FL-65Q mice (65Q, red) at presymptomatic (3 weeks) and early symptomatic (10 weeks) time points. Relative levels normalized to β-actin and Hprt1 are given as a fold change of wild-type. Two-way ANOVA, v1, genotype; v2, age, mean ± SEM (n=6), ∗∗∗p < 0.001. (I and J) Levels of Tfeb protein in the supernatant fraction of cerebellar lysates at 14 weeks of age (I). Densitometric analysis (J) reveals a significant decrease in ATN1-FL-65Q;GFP-LC3 (65Q) compared to WT;GFP-LC3 (wt). One-way ANOVA, mean ± SEM, ∗∗p < 0.05. (K) qPCR analysis of Ctsb and Prkag mRNA levels in the cerebellum of wild-type (wt, white), ATN1-FL-26Q (26Q, blue) and ATN1-FL-65Q mice (65Q, red) at an early symptomatic (10 weeks) time point. Relative levels normalized to Hprt1 are given as a fold change of wild-type. One-way ANOVA, mean ± SEM (n=6), ∗p < 0.05, ∗∗p < 0.01, ∗∗∗p < 0.001. (L) Whole-cell lysates of human fibroblasts from healthy control and DRPLA patients were subjected to western blot analysis for endogenous LC3-I and LC3-II as well as p62. Induction of autophagy with Rap and block with BafA1 for 6 hr resulted in increase of LC3II compared to DMSO in control fibroblasts, while there was no acute response observed in DRPLA patient samples. No changes in p62 levels were evident after 6 hr acute treatment. (M and N) Analysis of the autophagy flux in control and DRPLA fibroblasts (DRPLA 17) transfected with the tandem RFP-GFP-LC3B reporter. Starvation in Hank's balanced salt solution (HBSS) medium was used to induce autophagy, BafA1 treatment to inhibit lysosomal degradation. Autophagosomes are marked by yellow signal as a result of combined RFP and GFP double fluorescence. Due to quenching of the GFP signal in acidic environment autolysosomes show RFP fluorescence only. Representative images acquired with Nikon spinning disc confocal microscope display a greater amount of autophagosomes and autolysosomes in control fibroblasts compared to DRPLA after starvation in HBSS for 3 hr (M). Quantification in (N) demonstrates a significant increase in both autophagosomes and autolysosomes in control but not in DRPLA cells after starvation. Addition of BafA1 to starvation medium resulted in a greater number of GFP+ RFP+ puncta as compared to starvation only in control cells. No changes were significant in DRPLA patient fibroblasts (see also Figure S6H). Significance values in the columns show differences for fed versus starved condition and starved versus + BafA1 condition for RFP+ or GFP+ RFP+ puncta. One-way ANOVA, mean ± SEM, ∗p < 0.05, ∗∗∗p < 0.001. Significance values between control and DRPLA cells for overall puncta are shown above the horizontal bars, two-way ANOVA ∗∗∗p < 0.001; v1, genotype; v2, - total GFP+ and GFP+ RFP+ puncta. Scale bar, 20 μm.See also Figures S3 and S4.

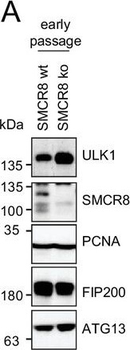
Restored regulation of ULK1 protein levels in SMCR8 knockout cells. (A, B) Early (A) or late (B) passages of HAP1 SMCR8 wildtype (wt) or knockout (ko) cells were subjected to SDS-PAGE and immunoblot with indicated antibodies. PCNA served as loading control. (C) 293T SMCR8 wildtype (wt) or knockout (ko) cells were analyzed as in (A). (D) 293 T cells were transfected with non-targeting control (sicon) or SMCR8 siRNA. Half of the cells were re-transfected every 2–3 days with non-targeting control (sicon) or SMCR8 siRNA while the other half was harvested and subjected to SDS-PAGE and immunoblotting with indicated antibodies.
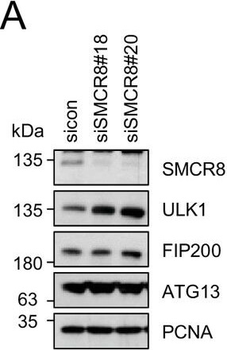
SMCR8 regulates ULK1 gene expression. (A) Lysates from 293 T cells transfected with non-targeting control (sicon) or SMCR8 siRNA were subjected to SDS-PAGE and immunoblotting with indicated antibodies. PCNA served as loading control. (B) Lysates from 293 T cells transfected with non-targeting control (sicon) or SMCR8 siRNA as well as with HA-tagged SMCR8 were subjected to SDS-PAGE and immunoblotting with indicated antibodies. PCNA served as loading control. exp. = exposure. (C) Lysates from 293 T cells transfected with indicated siRNAs and grown in absence (DMSO) or presence of 250 nM Torin1 for 2 hr were lysed and analyzed as in (A). Vinculin served as loading control. (D, E) 293T (D) or U2OS (E) cells were transfected with indicated siRNAs for 72 hr prior to RNA isolation, preparation of cDNA and RT-qPCR with ULK1, FIP200 and SMCR8 specific primers. Error bars represent SEM. Significance was determined using two-way ANOVA compared with sicon. All experiments were performed n=3. Restored regulation of ULK1 protein levels in SMCR8 knockout cells. (A, B) Early (A) or late (B) passages of HAP1 SMCR8 wildtype (wt) or knockout (ko) cells were subjected to SDS-PAGE and immunoblot with indicated antibodies. PCNA served as loading control. (C) 293T SMCR8 wildtype (wt) or knockout (ko) cells were analyzed as in (A). (D) 293 T cells were transfected with non-targeting control (sicon) or SMCR8 siRNA. Half of the cells were re-transfected every 2–3 days with non-targeting control (sicon) or SMCR8 siRNA while the other half was harvested and subjected to SDS-PAGE and immunoblotting with indicated antibodies. PCNA served as loading control.

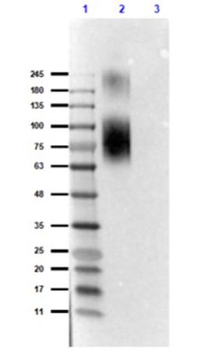
Western Blot of Rabbit Anti-ATG13pS318 Antibody. Lane 1: Opal Prestained Molecular Weight Marker. Lane 2: BSA Conjugated ATG13 pS318 peptide - reduced [0.2 µg]. Lane 3: BSA Conjugated ATG13 S318 peptide - reduced [0.2 µg]. Primary Antibody: Anti-ATG13pS318 [Rabbit] Antibody at 1.0 µg/mL overnight at 2-8°C. Secondary Antibody: Anti-Rabbit IgG [Goat] Peroxidase conjugated (p/n orb347673) at 1:40000 for 30 mins at RT. Block: Blocking Buffer for Fluorescent Western Blotting (p/n orb348637) for 1 hr at RT. Expected: detects the P-peptide and does not detect the NP-peptide. Exposure: 6.1sec.

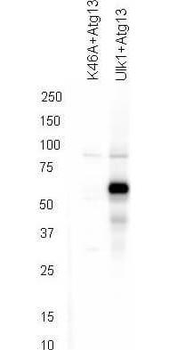
Western blot using Biorbyt's affinity purified anti-ATG13 pS318 antibody shows detection of phosphorylated ATG13 in 293T cells engineered to coexpress Ulk1 and Atg13 (Ulk1 + Atg13). In the left lane was loaded kinase-dead hypophosphorylated Ulk1-K46A mutant + ATG13. The right lane contains the 293T Ulk1 + ATG13 lysate and shows detection at approximately 57 kDa. The antibody was purified and resolved by SDS-PAGE, then transferred to nitrocellulose membrane. The membrane was blocked with 5% Blotto (p/n orb348624) and probed with the primary antibody at 1 µg/mL overnight at 4°C. After washing, the membrane was probed with Goat Anti-Rabbit HRP secondary 1:5000 in detection buffer (p/n orb348637) for 45 minutes at room temperature.
- Item 1 of 6
ATG13 (phospho-S318) antibody [orb345688]
DOT, ELISA, FC, WB
Human
Rabbit
Polyclonal
Unconjugated
100 μg

Submit a review
Filter by Rating

- 5 stars

- 4 stars
- 3 stars
- 2 stars
- 1 stars
